
Learning Mathematics Through Inquiry and Collaboration Using Real-Life Situations
Written by: Umi Salamah – Math Teacher
At SIS Palembang, Mathematics learning uses the Singapore curriculum, which emphasizes students’ problem-solving abilities. There are five components of the curriculum framework as a guide to achieving these goals: concepts, skills, processes, metacognition, and attitudes.
With this framework as a guide, I strive to present learning through methods and approaches that engage students in active participation and thinking. I facilitate, support, and assist them in solving Mathematics problems. One approach I use is inquiry-based and collaborative learning for the topic of Tally Charts and Picture Graphs in Grade 2.
Why did I choose this approach? Because I believe that learning Mathematics is not simply about students opening a book, the teacher explaining, and then answering the questions in the book. This traditional approach can be used occasionally, but it is less effective for students to deepen a concept in Picture Graphs. Through inquiry based and collaborative learning experiences, students are encouraged to explore ideas, ask questions, think critically, and communicate their mathematical thinking with others. Students need to be directly involved in discovering a concept through collaborative activities related to their daily lives.
For example, in the textbook, there might be a tally chart or picture graph showing the number of students who chose their favorite fruit. I thought, why not ask them to become little researchers in class, collecting data directly, presenting it in tables, tally charts, and picture graphs, then presenting their findings, comparing them, and drawing conclusions. The activities were designed to be simple, fun, and appropriate for their level.
At the beginning of the lesson, I began by explaining the learning objectives, using an icebreaker to motivate students, and showing a short video showing examples of tally charts in tables and picture graphs. Then, I asked several questions about the data displayed in the video to assess their initial ability to read picture graph data. I then continued with an inquiry and collaborative approach to explore the topic of picture graphs.
I implemented four stages using the inquiry and collaborative approach:
1. Exploring and Generating Ideas
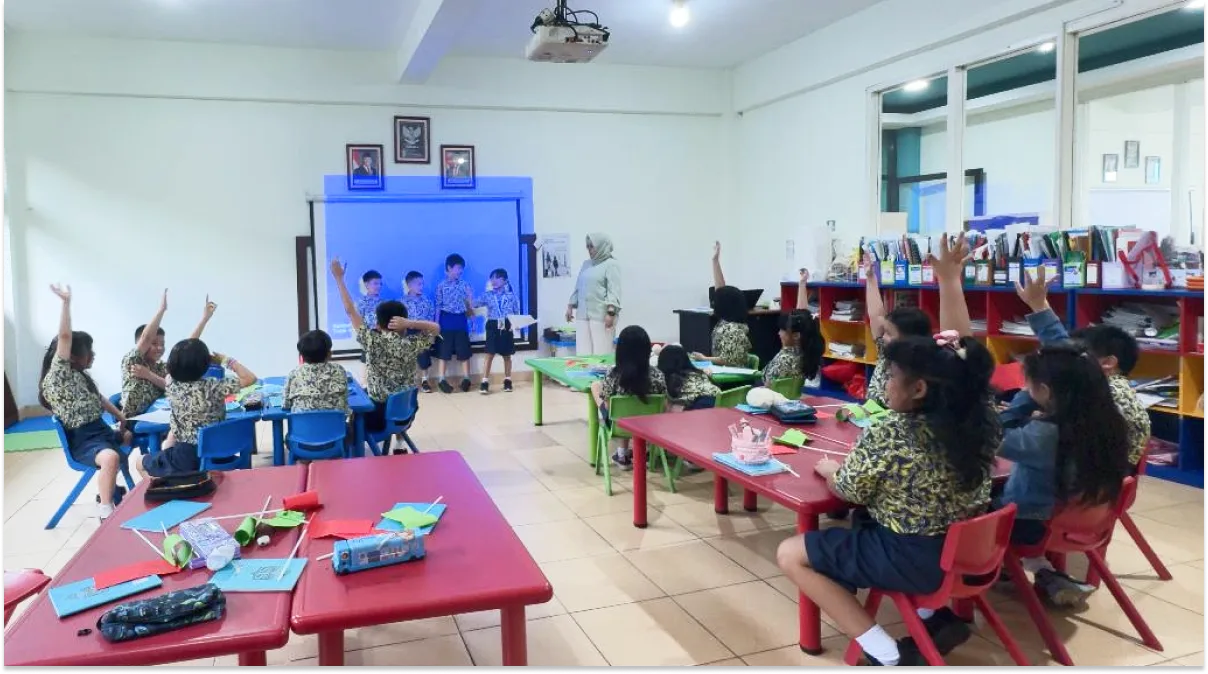
Students were divided into four groups and asked to discuss a survey topic or what data they wanted to collect in class. I provided one or two examples, then asked them to choose another topic. Each group had to choose a different topic. I circulated among the groups to ensure they understood the instructions and answered any questions they had.
For example:
“Miss, can we choose a topic about our favorite ice cream flavor?”
“Yes, why choose that topic?”
“Because we like ice cream and want to know what flavors our friends like.”
This simple question and answer session demonstrates that by connecting learning to everyday life, students will be more motivated to learn and care about their surroundings.
They also asked:
“Miss, what flavors can we include? Can we choose any flavors we want?”
“Discuss them together, and each of you can share your ideas about different ice cream flavors.”
Eventually, the four groups selected topics such as favorite colors, favorite online games, favorite ice cream flavors, and favorite fruits. Before surveying the rest of the class, each group first asked its own members about their preferences.
Through this process, students learned that collaboration makes decision-making easier. Every opinion was heard as they decided on the categories for their survey topics..
2. Surveying and Collecting Data
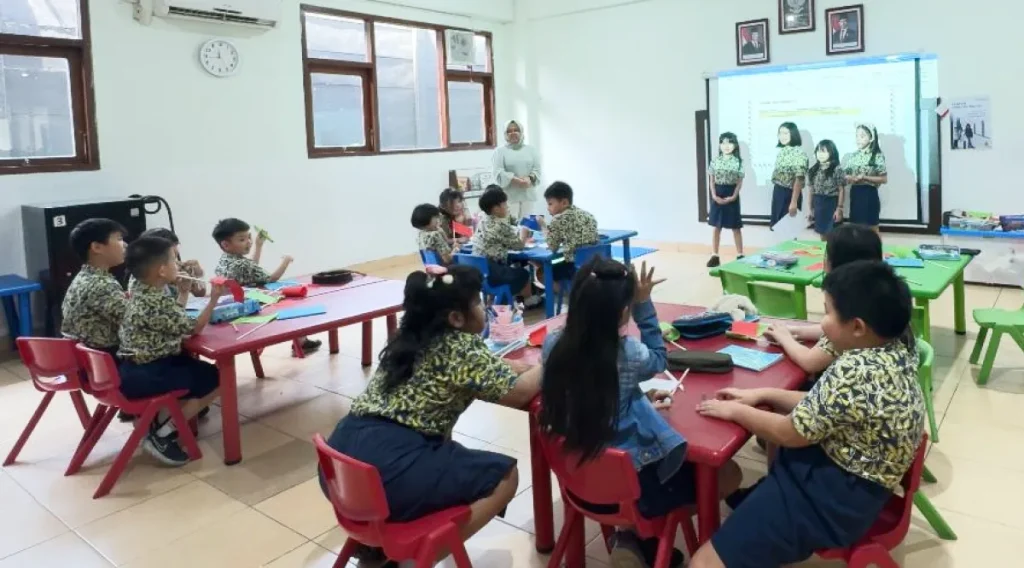
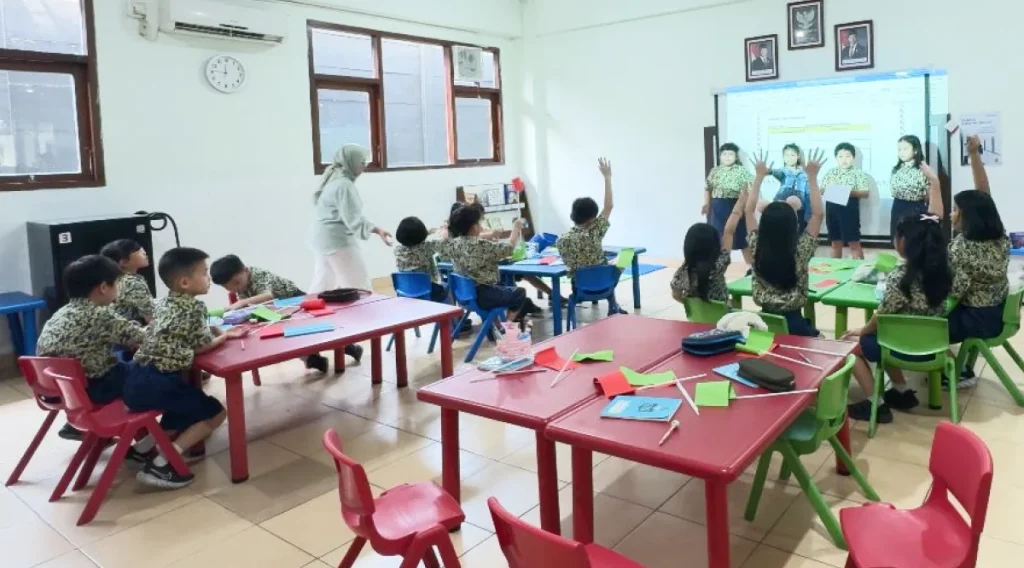
After deciding on a topic together, each group was asked to come forward to conduct a survey. I guide students on how to convey their ideas and ask questions effectively. I ask them to begin with an introduction and explain the purpose of the survey. Then, I ask them to name a topic and list options so they can choose their favorite. For example, the favorite ice cream flavors they mentioned were chocolate, strawberry, vanilla, and matcha. They asked, in simple terms, “Who likes chocolate ice cream?”
Students then raised their hands, and the assigned group members counted and recorded the responses using tally marks on the worksheet provided. Throughout the process, I supported students when necessary. For example, if a student raised their hand for both vanilla and matcha, I reminded them, “Please choose only the flavor you like the most so that we can collect accurate data.”
This activity helped students build confidence and improve their communication skills while interacting with their classmates. They were enthusiastic and actively engaged throughout the learning process.
3. Handling and Analyzing Data
After all groups had completed data collection, I checked that the tally marks matched the number of students. Then, they present the data obtained in the form of picture graph posters, using their own creativity. They are given the option to search for ideas for images or symbols online using an iPad and draw them themselves, or they can use images I provide and cut and paste them onto their posters. I walk around with students as they complete their assignments and ask questions as part of my interaction with them.
For example:
“What symbols or images are you using in your graph?”
“Which ice cream flavor is the most popular?”
The students enthusiastically replied, “Vanilla!”
This activity encouraged students to collaborate, be creative, take responsibility, and persevere in completing their tasks. They also learned that Mathematics is not only about numbers but can also be connected to real-life situations.
4. Presenting Data
Students presented picture graph posters and explained the data they found through the “Two Stay, Three Stray” activity. Two students, representing each group, stayed in their group to explain to visitors, while the other three students took turns visiting other groups. The visiting students then shared the information they had gathered with their remaining classmates.
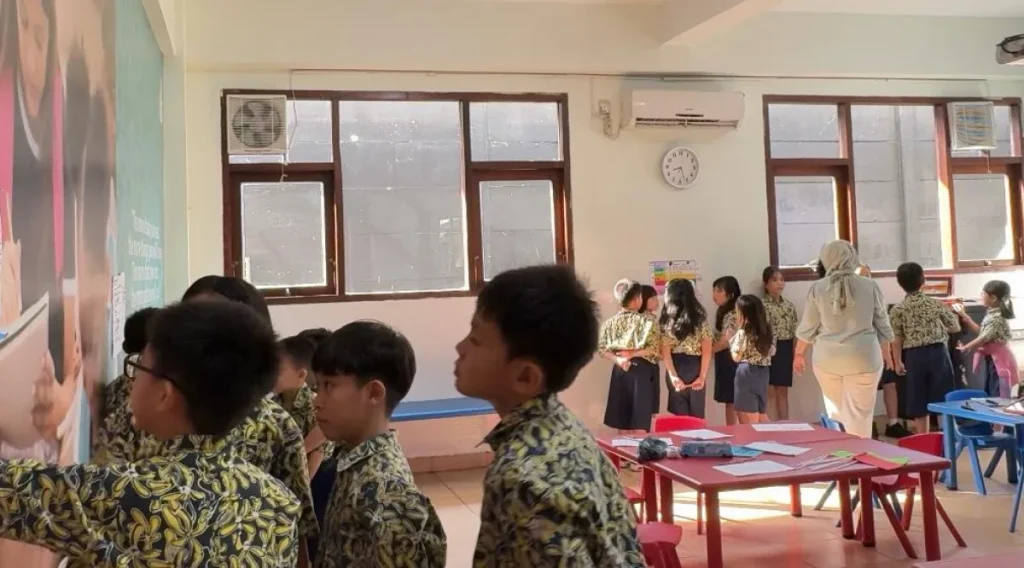
During this activity, I provided questions and feedback to each group. Students also had opportunities to ask questions and engage in discussions with their peers. Each group presented their picture graph data by identifying the most popular and least popular items. They also compared different categories to find how many more or fewer students preferred one item over another and calculated the total number of students who chose two or three categories combined. Through these discussions and presentations, students developed their ability to interpret, analyze, and communicate information using picture graphs.
At SIS Palembang, we believe that meaningful learning happens when students actively participate in the learning process. Through this activity, I observed that students were more engaged and motivated when they learned through inquiry and collaboration. By collecting and analyzing real data from their classmates, they were able to connect Mathematics to their everyday lives and develop a deeper understanding of picture graphs. Many students became more confident in sharing their findings and explaining their thinking to others. They also learned to listen attentively, ask questions, and show respect for their peers’ ideas during presentations.
I also observed positive attitudes such as responsibility, perseverance, confidence, interest, engagement, and teamwork being nurtured among the students. As a teacher, this experience encourages me to continue creating meaningful learning experiences that foster curiosity, collaboration, and confidence in Mathematics.